A platform built for clarity
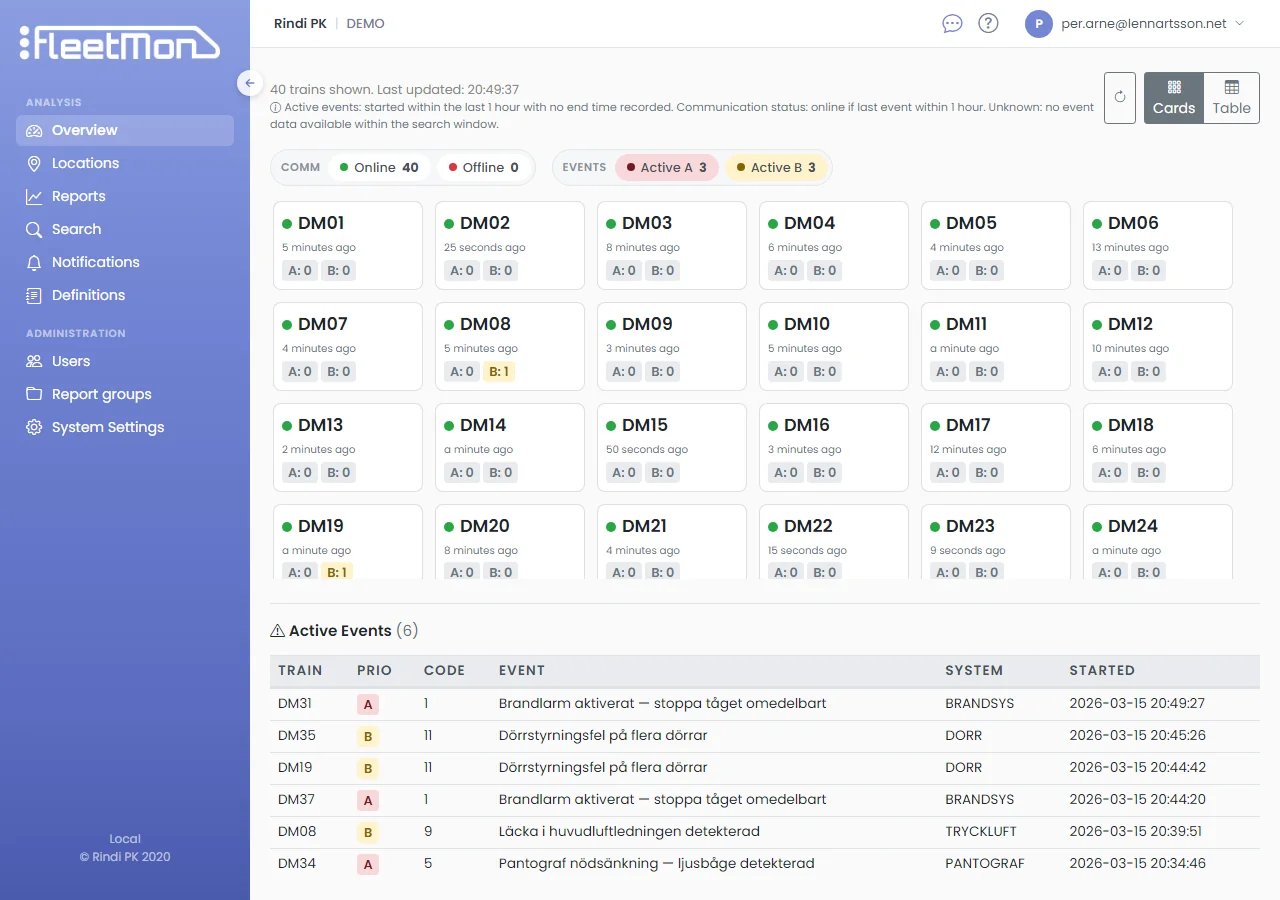
Your entire fleet, at a glance
See communication status, active diagnostic data, and fleet health across your entire operation — all on one screen.
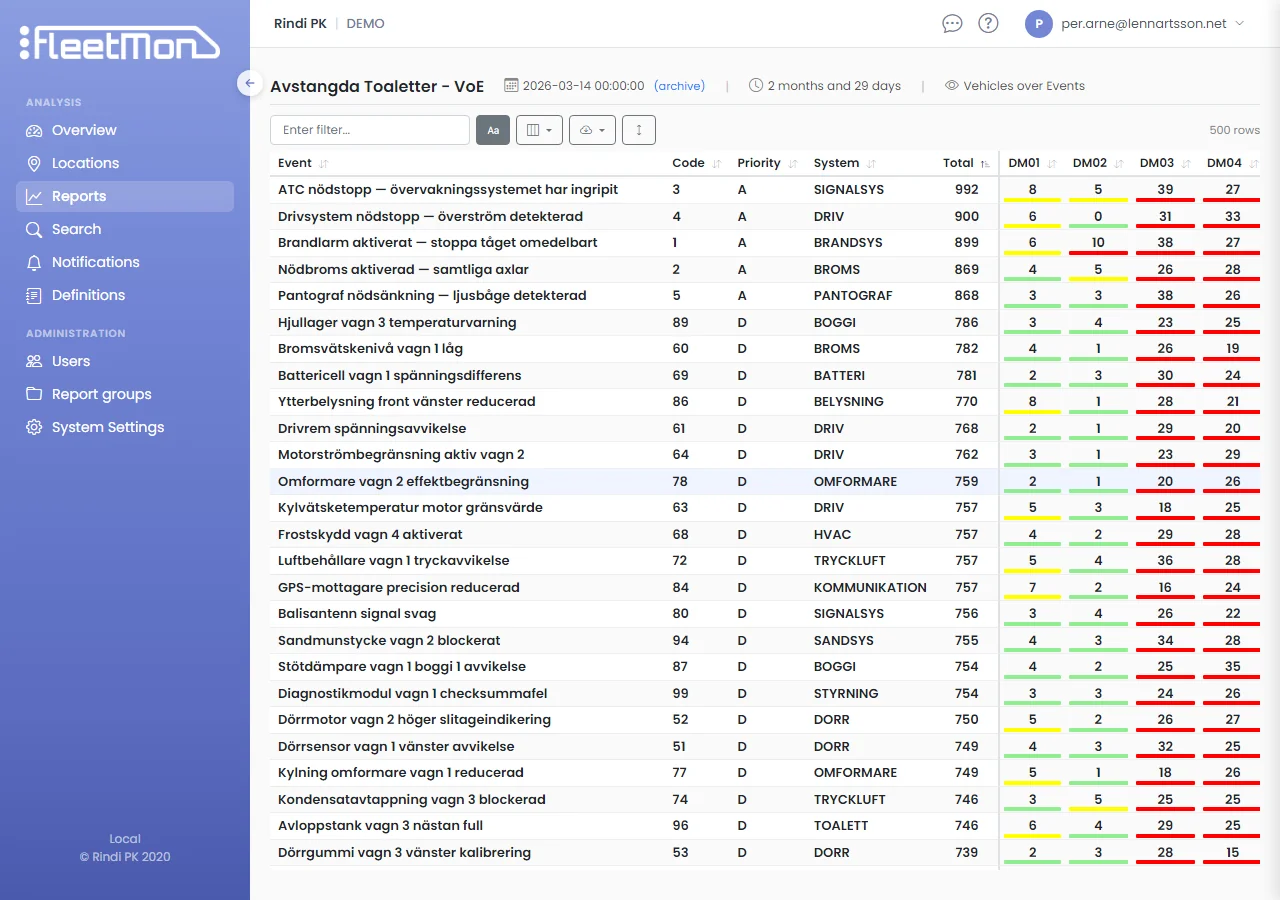
Patterns revealed through color
See what matters at a glance. Color-coded reports reveal patterns across your fleet — delivered on schedule or on demand, with built-in alerts when limits are exceeded.
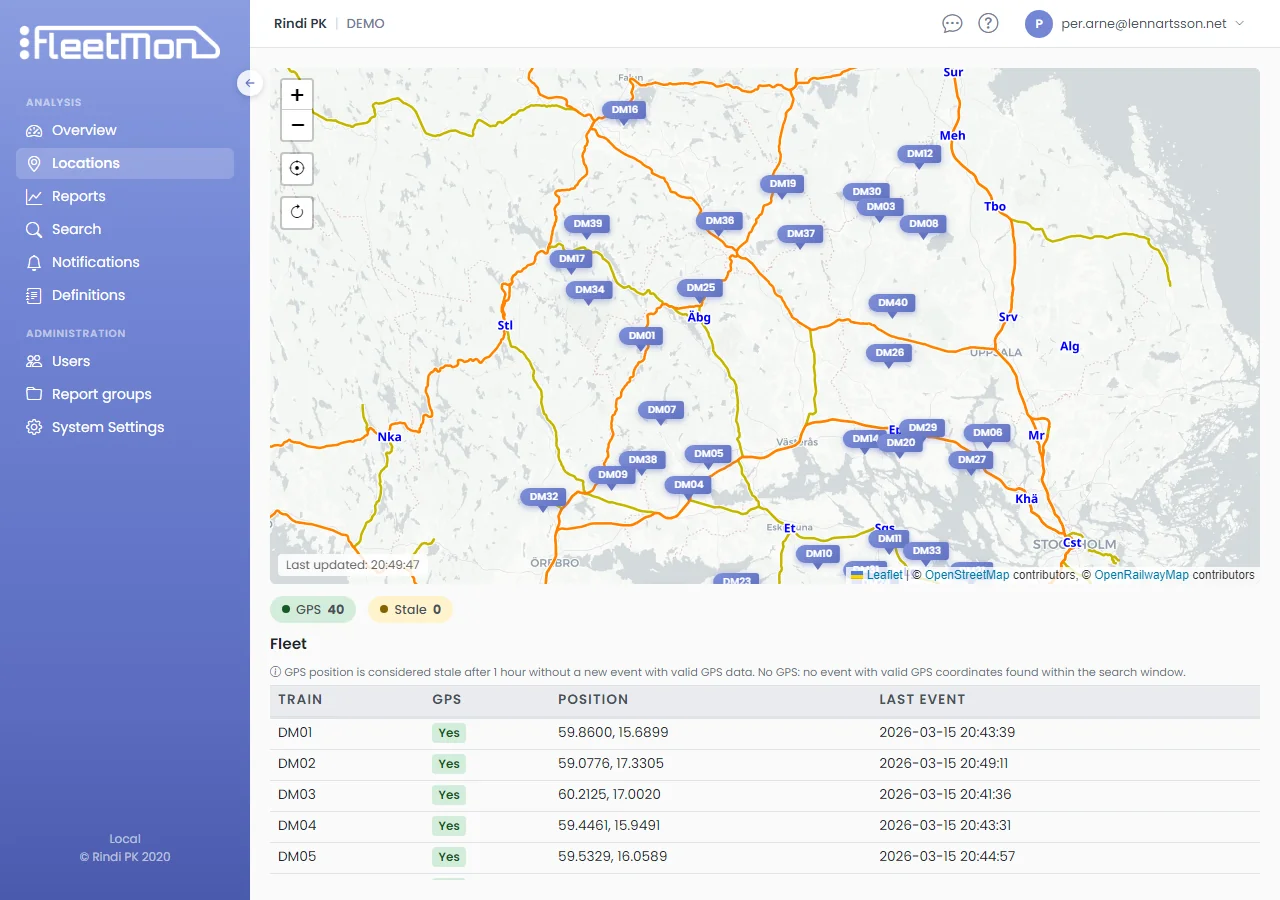
Every vehicle, pinpointed
Live map showing where every vehicle is. Geofencing lets you follow up on diagnostic data within exactly the area that matters.
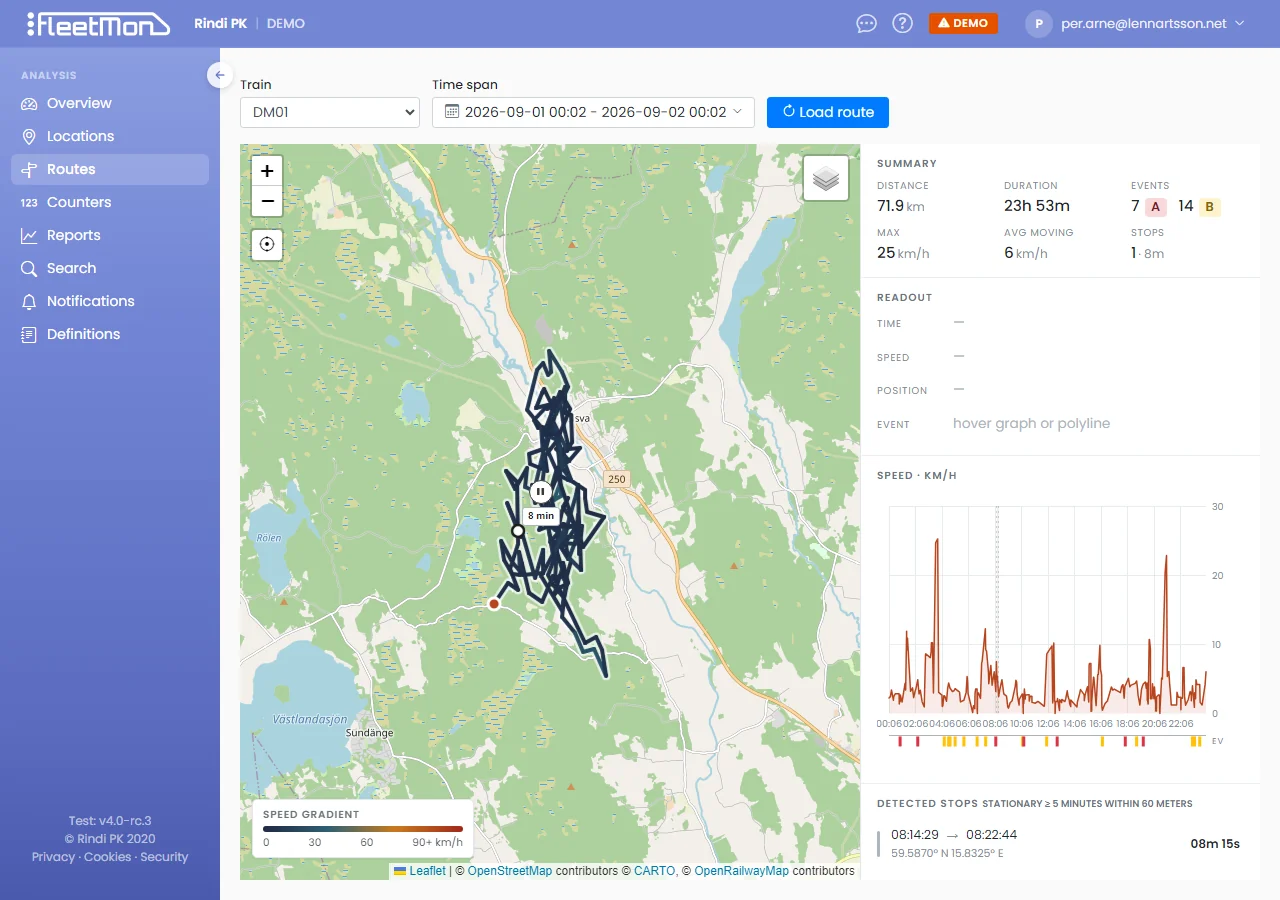
Every journey, replayed
Pick a vehicle and a time span to replay its route — a speed-coloured trajectory on the map, detected stops, and a synced speed graph with every event along the way.
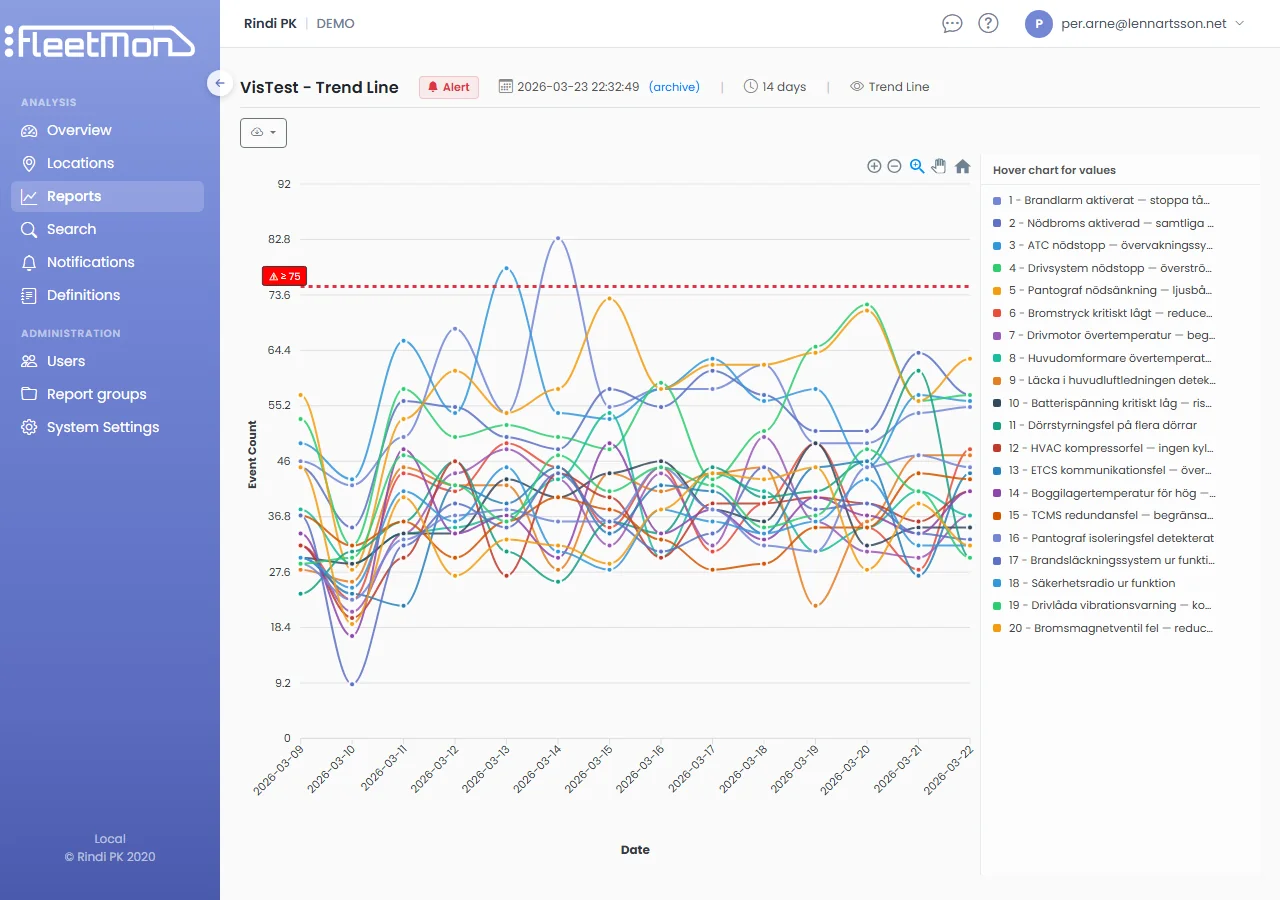
From data points to decisions
Spot trends as they emerge. Line charts, pivot tables, and deep search across your entire diagnostic history give you the tools to move from reactive to proactive.
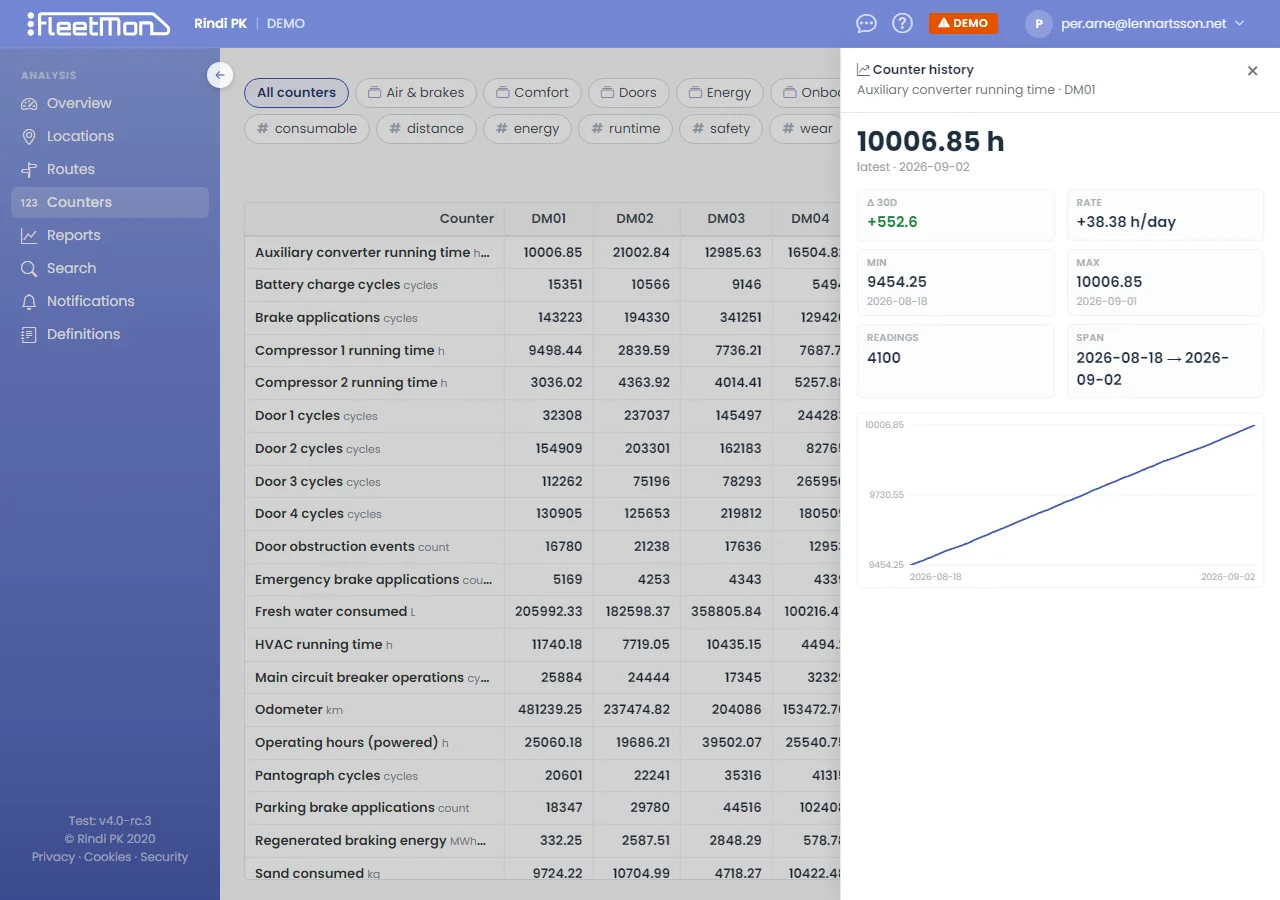
Wear and usage, counted
Running hours, door cycles, odometer and more — every counter across the fleet in one matrix, with full history behind each value so trends and rate of change are one click away.
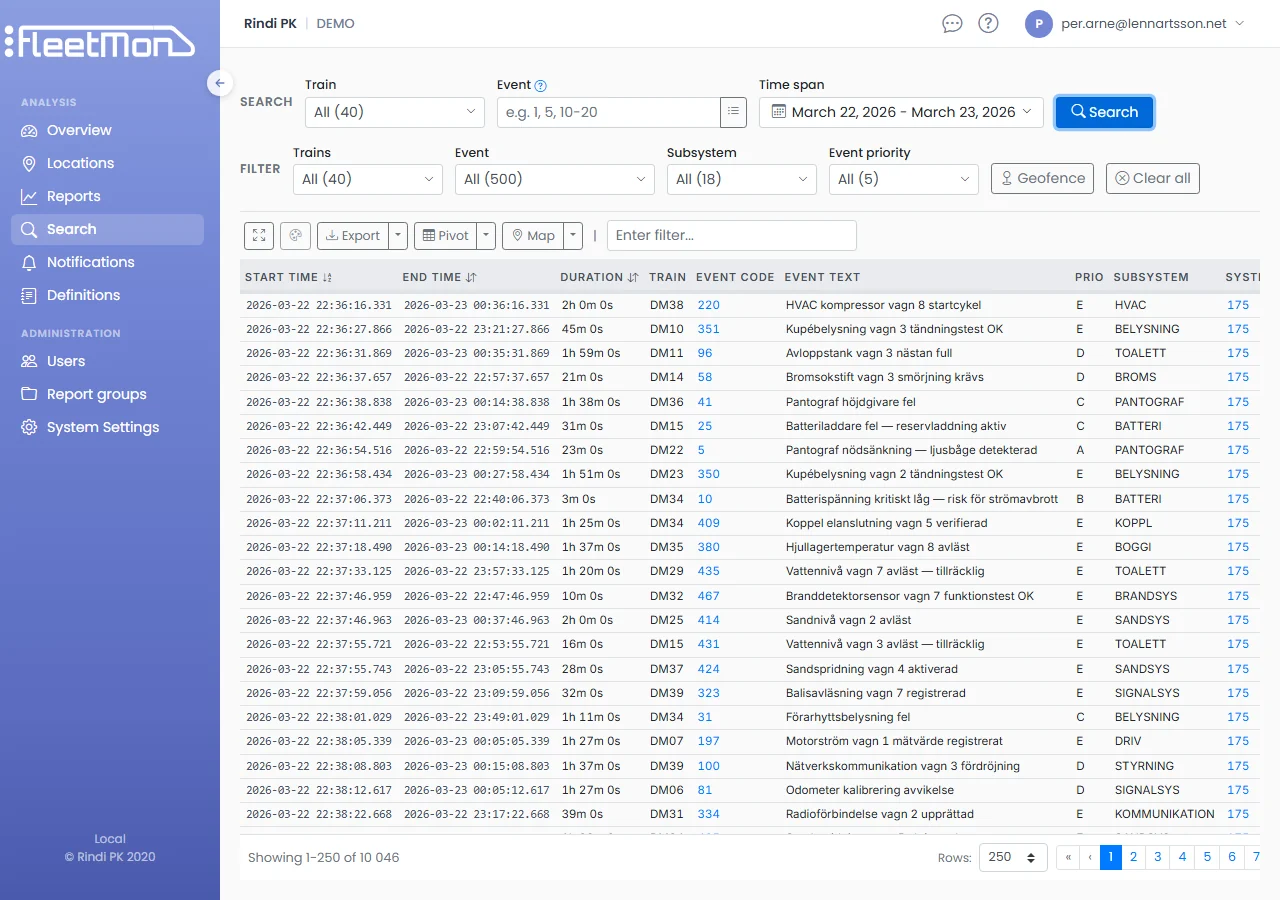
Find anything, instantly
Query any diagnostic across your entire fleet history. Filter by vehicle, data type, date range, priority level, and location — then drill down into every detail.
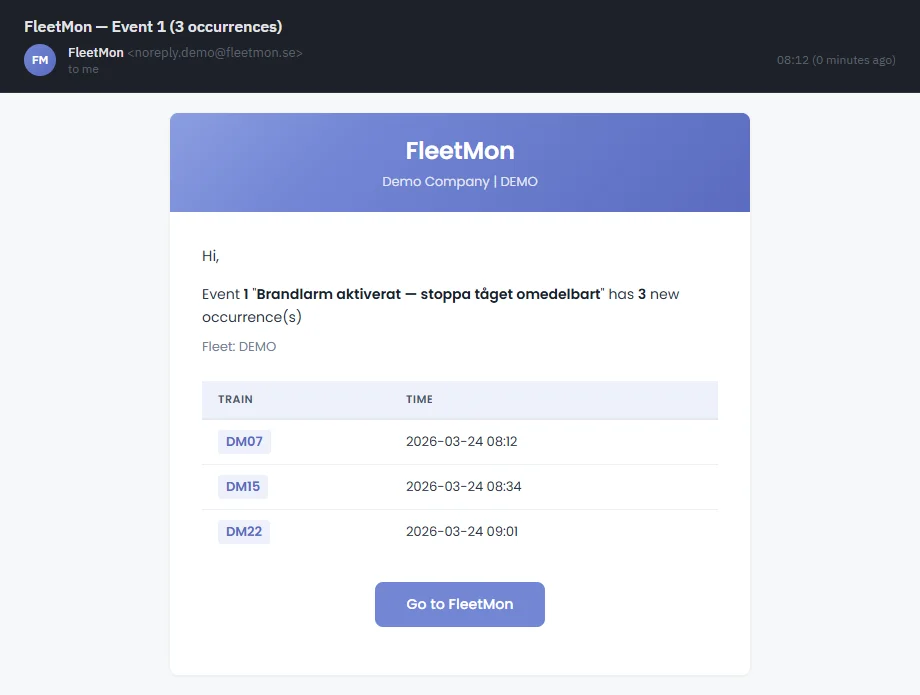
The right people, the right moment
The right people know the moment something happens. Configure what to watch — FleetMon handles the rest.